


Introduction to Performance Monitoring on Apple Silicon Macs:
As Apple continues to innovate with its M1 chip, Apple Silicon Macs have gained popularity for their impressive performance and power efficiency. To make the most of these devices, it’s essential to monitor their performance and resource utilization. In this article, we explore powerful command-line tools like asitop that enable users to track CPU, GPU, memory, and power metrics on their Apple Silicon Macs.
asitop:
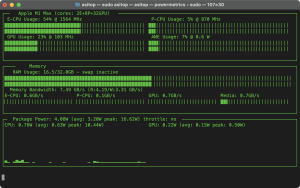
A Python-Based Performance Monitoring Tool: asitop is a Python-based command-line tool inspired by nvtop, specifically designed for Apple Silicon (M1) Macs. It offers a comprehensive set of utilization information, including CPU (E-cluster and P-cluster) and GPU utilization, frequency, and ANE utilization measured by power. Additionally, asitop provides memory information, such as RAM and swap size and usage. Furthermore, it offers power information, including CPU power and GPU power, presented through intuitive charts displaying peak power and rolling averages. asitop leverages the built-in powermetrics utility on macOS, which grants access to various hardware performance counters.
Utilization Information Provided by asitop:
With asitop, users can gain valuable insights into their Apple Silicon Mac’s performance, including:
- CPU (E-cluster and P-cluster) and GPU utilization
- CPU and GPU frequency
- Accelerated Neural Engine (ANE) utilization measured by power
- Memory details, such as RAM and swap size and usage
- Intuitive charts for CPU and GPU power, displaying peak power and rolling averages
Other Command-Line Tools for Apple Silicon Performance Monitoring: While asitop stands as a powerful option for performance monitoring on Apple Silicon Macs, other command-line tools offer specific metrics to help users fine-tune their system’s performance.
Conclusion:
Monitoring the performance of Apple Silicon Macs is crucial to optimizing their capabilities. Tools like asitop and others mentioned in this article empower users to track CPU, GPU, memory, and power utilization, providing valuable data for system analysis and troubleshooting. With the continued advancements in Apple’s M1 chip, these performance monitoring tools play a vital role in ensuring a seamless computing experience on Apple Silicon Macs.